Explore and Interactive Charts with CryptoInsights
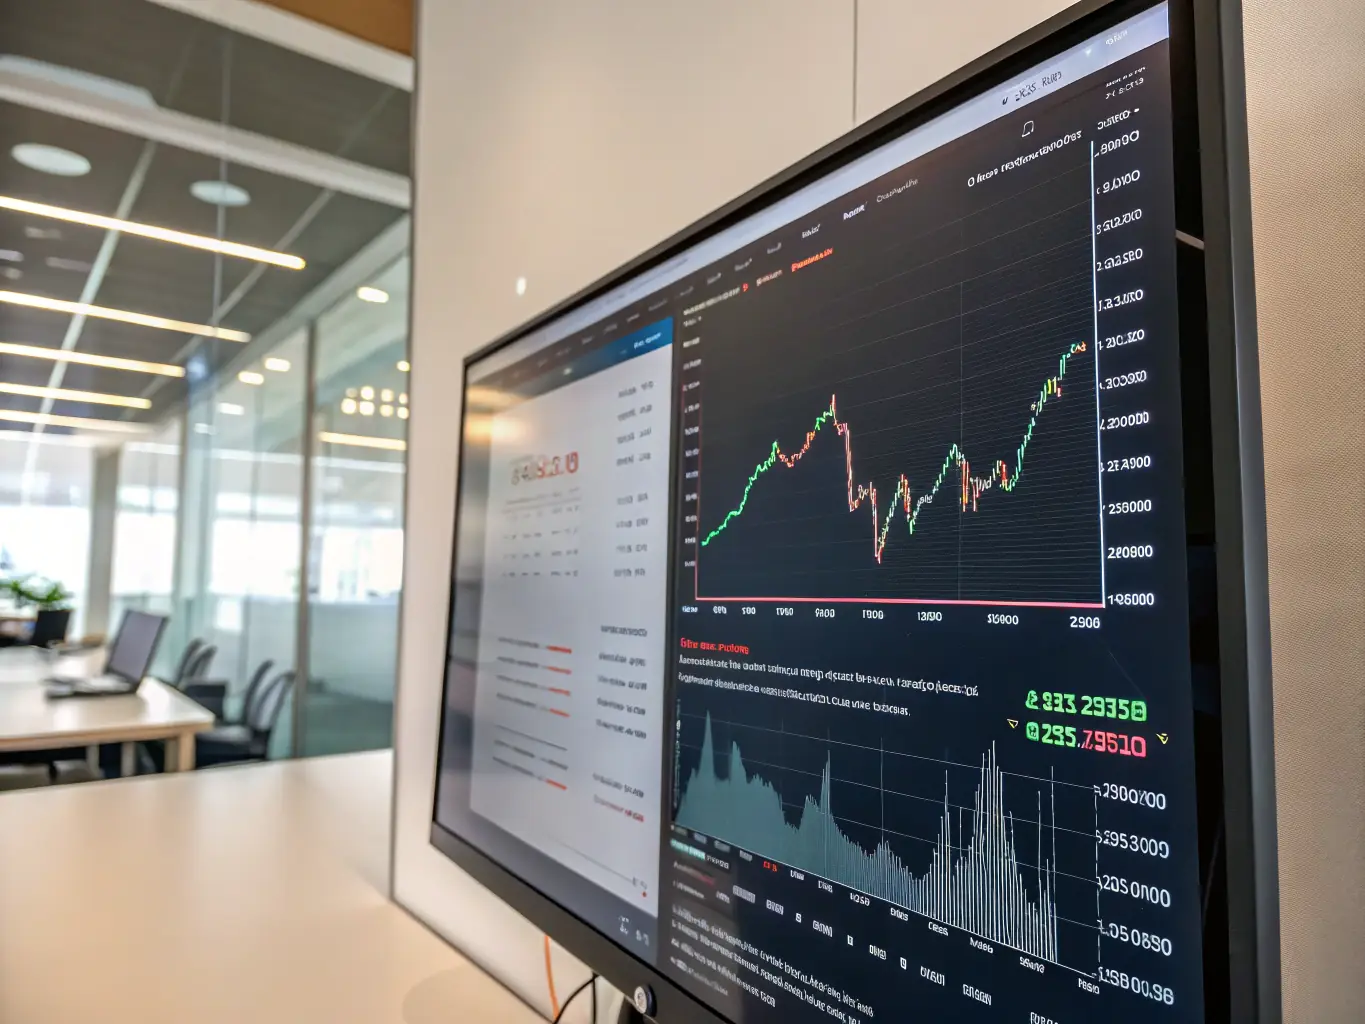
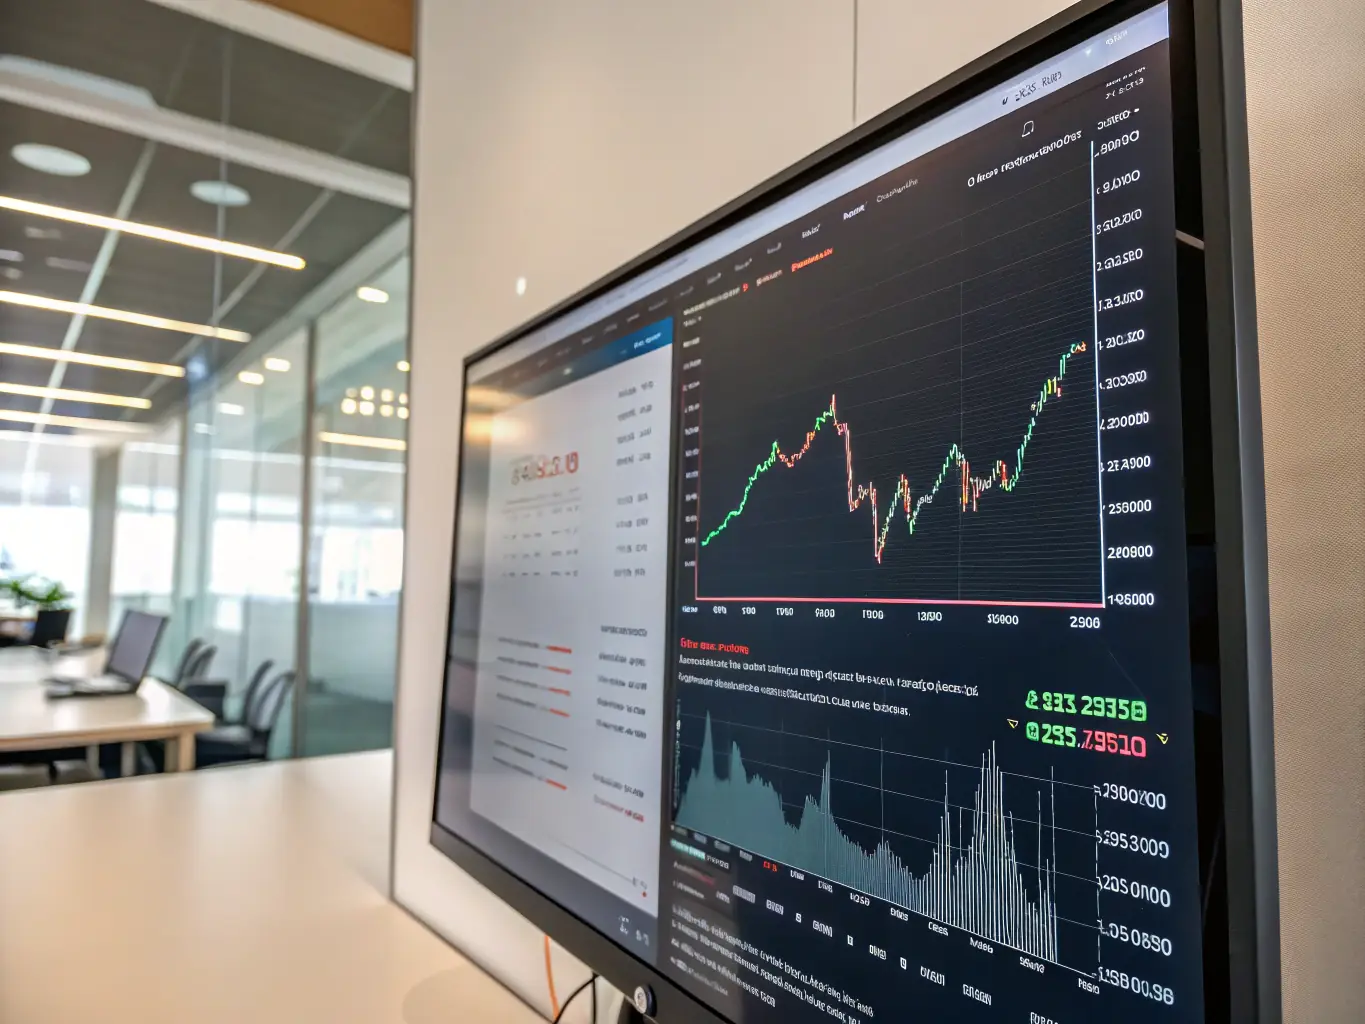
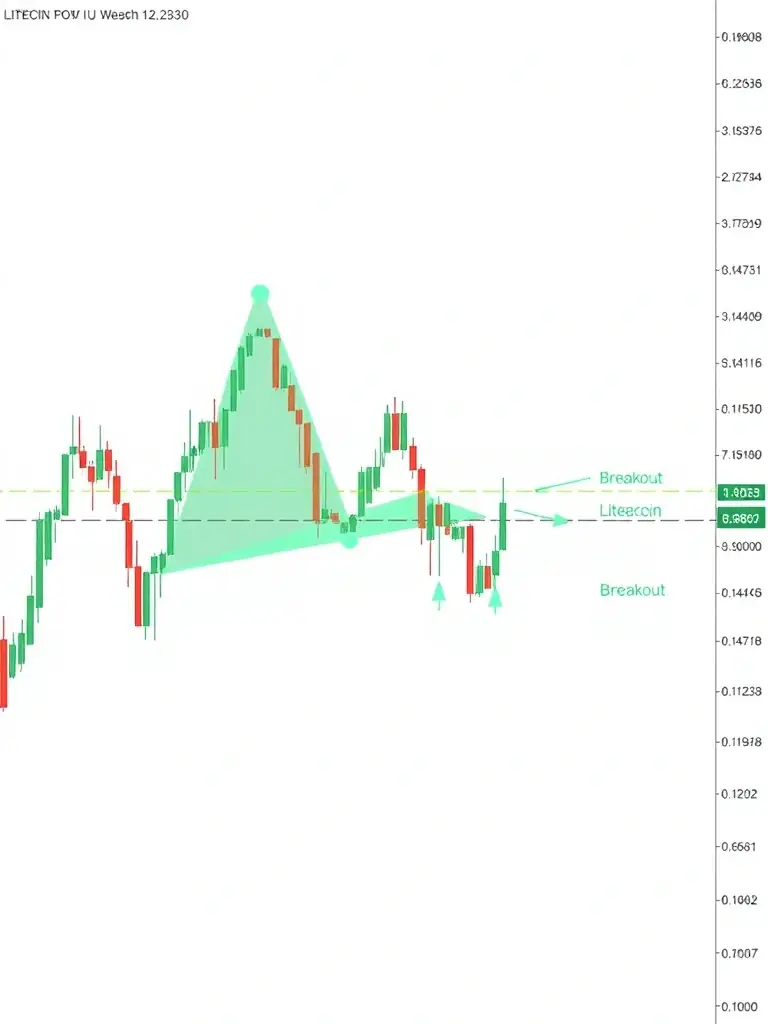
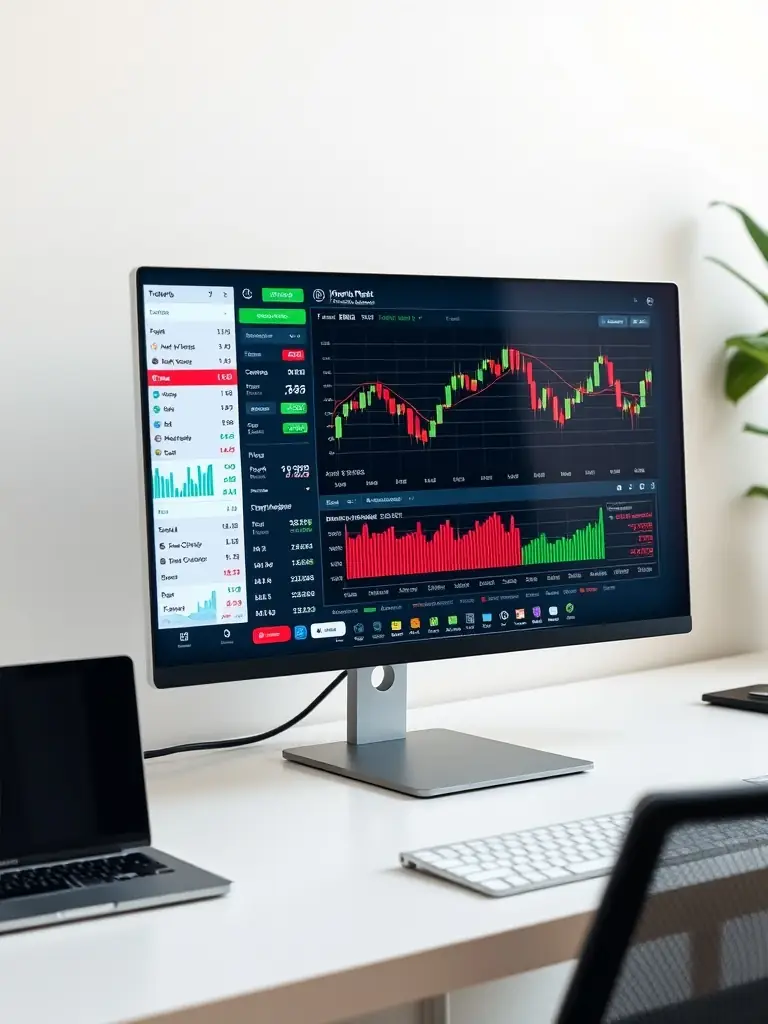
Stay ahead of the curve with CryptoInsights’ real-time data and interactive charts. Our platform provides comprehensive price charts for a wide range of digital currencies, empowering you to track market trends and make informed trading decisions. Whether you’re a novice or experienced trader, our tools are designed to help you succeed.

Bitcoin (BTC) Real-Time Data
Track Bitcoin's price movements with our real-time charts. Analyze trends, identify patterns, and make informed decisions based on the latest market data. Stay ahead of the game with CryptoInsights.

Ethereum (ETH) Price History
Dive into Ethereum's price history with our interactive charts. Customize the time frame, add technical indicators, and gain valuable insights into ETH's market behavior. Make smarter trades with CryptoInsights.

BTC/ETH Correlation Chart
Analyze the correlation between Bitcoin and Ethereum with our customizable charts. Identify trends, understand market dynamics, and refine your trading strategies. CryptoInsights provides the tools you need to succeed.


